Methodology
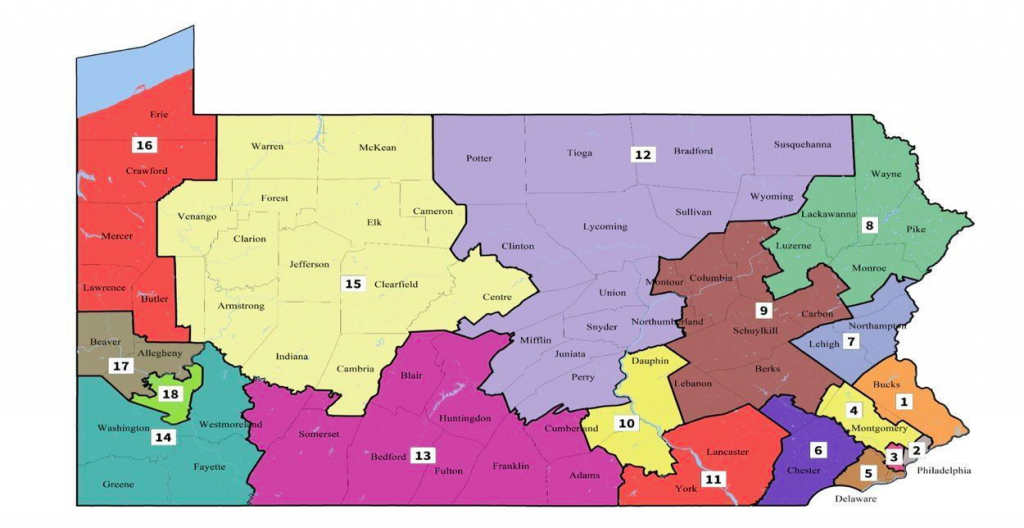
PA Congressional District Map 2011 vs. 2018 Remedial Map
The 2011 map illustrates classic gerrymandering techniques:
- “packing”“packing” voters dilutes their power. A district with 70% share of one party’s voters elects the same candidate as that district with only 60% share. The extra 10% of voters “waste” their voting power. opposing voters into a few districts
- “cracking”“cracking” voters dilutes their power. Splitting 10% of voters from a district with 55% of one party’s share could shift election outcomes to the opposing party. opposing voters into many districts
- stretching districts toward favored partisan concentrations, ignoring political boundaries
- carefully fashioning safe seats for incumbents and favored candidates


The 2018 remedial map illustrates reasoned adherence to strong design standards:
- Most district boundaries follow county and municipal boundaries
- District shapes achieve recognizable compactness
- No evidence of packing or cracking
Result: A more fair and balanced congressional map.
%20(2).jpg)